

Cardio
Sites of Interest


Cardiac Fat Database - Computed Tomography
The amount of fat on the surroundings of the heart is correlated to several health risk factors such as carotid stiffness, coronary artery calcification, atrial fibrillation, atherosclerosis, cancer incidence and others.
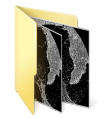
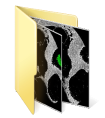
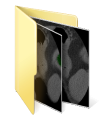
The images provided here were manually segmented by a physicist and a computer scientist and they consist of a segmentation of the epicardial and mediastinal fats on non-contrasted cardiac CT scans. The red color represents the epicardial fat, the green color represents the mediastinal fat and the blue color represents the gap between the epicardial and mediastinal fats, which can also be interpreted as the pericardium.
Further details on the database can be found at the bottom of the page.
Database Download (Weka)
| Weka Database | |
|---|---|
 Download Weka Database |
Download Weka Database (Reduced Features - Faster) |
Details:
This database is composed of features extracted from the 20 patients that compose the database available below.
We have extracted as features: the pixel grey level, a Gaussian weighted vicinity, the position x, y and z, where z is the index of the slice. Moreover, we have also selected the x and y positions relative to the center of gravity of the image and texture-based features from a neighborhood of variable size that encapsulates the iterated pixel at its center, i.e., a surrounding window of pixel values.
Some features were extracted from this area, such as: (1) a simple arithmetic mean of the grey levels, (2) moments of the co-occurrence matrix, (3) moments of the grey values, (4) run percentage, (5) grey level non-uniformity and (6) a Gaussian-weighted mean of the grey values.
Database Download (Images)
| Patients (20 scans - approximately 1000 images) | ||||
|---|---|---|---|---|
| [1] Fat Images | [2] Ground Truth | [3] Ground Truth | [4] Ground Truth | [5] DICOM Files |
 Download Fat Images |
 Download Ground Truth (Fat Range[-200,-30]) |
 Download Ground Truth - (Higher Range [-200,500]) |
 Download Ground Truth - (Combined [-200,-30] and [-200,500]) |
Download DICOM Files of the Ground Truth |
Details:
[1] These images were linearly converted from [-200,-30] HU to 8-bit depth images.
[2] These are the [1] after a manual segmentation.
[3] These are the manual segmentation on the range [-200,500].
[4] These images are a combination of the images of [2] (segmented part) and [3] (rest of the image).
The absolute black (0) represents the background and should not be accounted as a fat pixel.
Attention!
You can use the images of the Ground Truth as you want as long as you reference our published work:
RODRIGUES, É.O.; MORAIS, F.F.C.; MORAIS, N.A.O.S.; CONCI, L.S.; NETO, L.V.; CONCI, A.; A novel approach for the automated segmentation and volume quantification of cardiac fats on computed tomography. Computer Methods and Programs in Biomedicine (Print), v. 123, p. 109-128, 2015.